New Tool On The Block: The LLVM/Clang Static Analyzer
Over the weekend, Gus Mueller turned me on to the LLVM/Clang static analyzer. And just in time, too, as I was polishing up my 2.2 release (which went up earlier today).
It’s an offshoot of the LLVM and Clang projects (read the respective pages on what they are if you don’t know already). The static analyzer analyzes your code and looks for problems, focusing mainly on memory allocation patterns, in this case, including Objective-C/Cocoa (retain/release/autorelease) and CF (CFRetain/CFRelease) semantics.
Take this contrived example for instance:
  id foo()
  {
      NSArray       *array = [[NSArray alloc] init];

      if ([array count] > 0)
      {
        return nil;
      }
      return [array autorelease];
  }
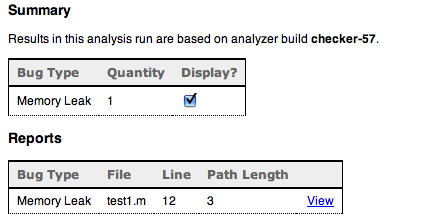
The example above will get you a report like this (it generates html):
Drilling down you get this (still in html):
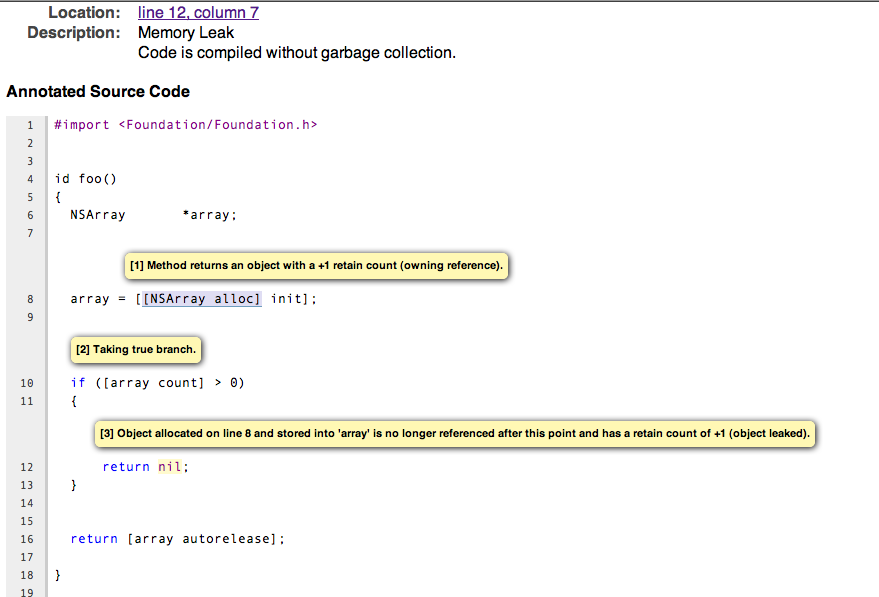
(click to enlarge)
Here you can see it pointing out [1] where the object was allocated [2] the branch it took and [3] the point where you leaked it. Pretty neat. It tries to follow every possible branch finding paths where you may have leaked an object. It also finds what it calls “dead stores” (when you assign a value to a variable but never use it again) and missing dealloc methods
As the project page says, it is very early in development. You’ll find that it does turn up a lot of false positives, especially with the missing deallocs. False positives for memory leaks seem to occur when you release something in a different scope than where you created it. For instance, I have this chunk of Apple code that wraps CFRelease() with it’s own function that checks for NULL first. The checker complained about this every time. Nonetheless, it did turn up some real leaks for me.
Aside from reducing the number of false positives, I’d also like to see the entries grouped by source file (it’s annoying jumping around between files) as well as some way to bring up the original source file by clicking on its name in the source code view. You will also see multiple entries for the same leak when the code traverses multiple paths that end up with the same leak which can be annoying.
In any case, I recommend downloading it and giving it a try. I’m not sure how thorough it is (i.e. whether it can supplant running your program through MallocDebug/Instruments/leaks) but it makes a great additional tool to add to your arsenal. Chances are it will look at some code path that you don’t test. Oh, and a couple tips:
- Make sure you do a clean build on your project first. The checker only runs on files that would normally be compiled (it sits in as your compiler). If your project is already built, then no files will be compiled/analyzed.
- Use the
-Voption, which will pop open a browser with the analysis page when done. Normally, it sticks the files somewhere under/tmpbut only shows the actual path when you start the run. Needless to say, that bit of text scrolls off pretty quickly. - While the tool does come up with false positives, you’ll find that sometimes it finds something subtle that you may blow off as a false positive on first glance. Make sure you understand what it is flagging, even if it ends up being wrong.
I haven’t used it with a garbage collected program so I don’t know if it uses different techniques in such a case or is just plain unnecessary. Maybe the dead store detection becomes more important. Reports from anyone using this with GC are welcome.
Category: Debugging, Programming, Software, Tools 3 comments »
July 8th, 2008 at 12:16 pm
False positives are something we’re very concerned about, and we planning on addressing them in several ways. The memory leak checker you refer to doesn’t do inter-procedural analysis right now, and infers the effects of functions (e.g., CFRelease) from the strict naming conventions for these functions (as well as their type signatures). Once inter-procedural analysis is in place, the analyzer should be able to automatically handle wrappers to CFRelease and friends.
Inter-procedural analysis only is a partial solution, since the implementations of these functions might not be available to the static analysis tool (e.g., if they are buried in a library whose source is unavailable). A complementary solution is to provide attributes that can be affixed to the function prototypes of wrapper functions (which are declared in headers) that the checker can leverage to understand the a function has a certain functionality and thus reduce false positives. This solution is nice because it makes the checking more modular, and documents the interface of the function without requiring full-blown inter-procedural analysis. The syntax of these attributes would be similar to GCC attributes, but could easily be sugared with the use of preprocessor macros:
http://gcc.gnu.org/onlinedocs/gcc/Function-Attributes.html#Function-Attributes
Would attribute support like this be useful? Conceptually, we would add a few checker-specific attributes to Clang, and provide a header file that #defined a set of macros that expanded to these attributes when using Clang and would expand to nothing when not using Clang. That way GCC eats your code with no problems.
If this sounds like a good feature, feel free to shoot me an email directly, or send an email to the Clang developers’ mailing list:
http://lists.cs.uiuc.edu/mailman/listinfo/cfe-dev
July 8th, 2008 at 7:50 pm
Hi Ted,
Somewhat ironically, your comment was a false positive for the spam filter which is why it’s only appearing now (I had to go in and unmark it as spam).
As for false positives, I didn’t consider them a big deal as I know it’s early and that you guys will be refining it as time goes on. I think that no tool will be perfect in that regard and that maybe the focus should be to specify arbitrary blocks to be ignored by the checker. For instance, I’ve turned off the gcc check for shadowed variables because it would complain about me using the variable “index” (which I use a lot) because of some header somewhere that defined it. The point being that users may stop using the tool if it bugs them too much about the same thing over and over. I can see there being some odd pattern that the checker could not be reasonably catch but the programmer wants to leave the way it is. Giving the ability to have the checker skip these instances would do a lot towards alleviating this type of issue.
I’ll also send you an email about it but I just wanted to say that it’s a great tool and I’ve already found it useful in a production setting.
July 9th, 2008 at 3:32 pm
Hi Paul,
You’re absolutely right that a static analysis tool (or really any program analysis tool trying to do deep analysis of a program) won’t understand all the quirky patterns out there in real code, and there will be definitely times that programmers will want to silence the tool.
Your suggestion of using something like pragma blocks is similar to my suggestion about annotations (except that annotations usually have a finer granularity). Ideally, we would want such “escape hatches” to be check-specific, so that a programmer doesn’t inadvertently silence the tool for all warnings.
Similarly, programmers can amplify checks by annotating their code; for example, the GCC nonnull attribute allows user to specify that a function argument should never be NULL, and the static analysis tool can flag warnings appropriately (this is something that isn’t in there right now, but is easy to do and is in our queue).
Your comment also ties in with some of our goals for enhancing the workflow of such tools. Commercial tools like Coverity’s Prevent allow users to track issues across multiple runs of the tool, with the ideal situation being that users only need to inspect fresh issues. In the general case it’s both a hard problem from both a tool infrastructure and UI perspective, but I think that even limited issue tracking across analysis runs would be valuable. Users simply don’t want to look at the same false positive more than once, and even some bugs are intentionally left in because they aren’t slotted to be fixed. Repeatedly issuing warnings about the latter is noise that should be avoided if possible.
We’re going to keep the development of the tool very community (and demand) driven. When users find that a particular check is emitting too much noise, hopefully they will file a bug report so that we can either fix the problem in the analyzer itself or otherwise provide the facility to silence the particular problem that the programmer is seeing.