Category: Debugging


[self note]

October 4th, 2012 — 11:20am

While working on the most recent patch to Hazel, I stumbled across some code that made me scratch my head. It seemed the code was unnecessary and was causing the bug I was trying to fix. I ended up removing that code while doing the fix thinking I must have been drunk/high/had a gun to my head when I wrote that code originally. Initial tests seemed to confirm it as things were working at first. A couple days later I discovered an older bug had resurfaced. Sure enough, I began to realize why I wrote that odd piece of code back when. I ended up backing out my recent changes and making the fix with the original code intact. I also made another change which was to comment the code explaining why the hell I wrote it that way in the first place.

[self now] != [self future]

One of the nice things about being a solo developer is that you don’t have to deal with the overhead involved when working on a team. You don’t have issues with miscommunication that you would when working with others. Or do you? Like it or not, you are still a team. Sure, you probably don’t need to communicate things with someone else about a current issue, but you, yourself, now, is not the same person as yourself a year from now. You’ll find many times that intentions are lost through the annals of time so documenting things as if there are other programmers on your team is a worthy exercise. Comment your code. Write descriptive commit messages. Edit your wiki. Your future self will thank you for it.

8 comments » | Debugging, Programming

Fun with Glue

July 5th, 2010 — 11:41am

In my last post, I introduced a little adapter class called NoodleGlue. It’s a simple class that wraps around a block allowing you to use it as the target and action for APIs that require it. It also optionally can take an extra block that is executed when the glue object is deallocated. This allows you to do any cleanup. In my NSTimer category from last time, I used this cleanup ability to allow the object to unregister from any notifications. Being a category, I couldn’t hook into the -invalidate or -dealloc methods of NSTimer so I created a glue object with a clean up block which I then set as an associated object on the timer. As a result, when the timer was deallocated, so would my glue object and my cleanup block would be triggered.

In more general terms, what does this mean? With my glue object plus the associative references feature, you can inject your code into any object’s deallocation sequence. It’s like being able to be notified if any object is freed. I’ve wrapped this up in an NSObject category with a new method, -addCleanupBlock:, which allows you to add a block to be invoked when the object is deallocated. It’s probably more of a proof of concept than something you’d want to use in production code but you can find it in the latest version of NoodleKit (it’s tacked onto the end of the NoodleGlue class).

Now, this sounds pretty cool on paper but this may be one of those cases of a solution looking for a problem. Not to be deterred, I’ve come up with some contrived cases that might actually be useful.

Add extra cleanup for extra stuff you attached to an object

It’s how I used it in my NSTimer category. You can unregister notifications and invalidate objects which need more than just a -release call.

Zero out references

One of the cool things about weak references in a GC environment is that they nil themselves out when the object is collected. You can simulate this behavior when using retain/release by setting up a cleanup block to nil out your reference to the object in question.

Tracing/debugging deallocations

Sure, you can do this in the debugger or Instruments but in some cases you want to trigger more involved code that you can’t do in gdb. Also, in a multithreaded program where the timing affects whether the bug shows up or not, this allows you to track deallocations without setting a breakpoint in the debugger which might otherwise change the timing.

Test if objects are actually deallocated (unit tests)

Credit goes to Guy English for this one. If you need to do a unit test where you want to test your memory management, you can “do the glue” to test that objects actually get deallocated. The problem here is if it’s not working (i.e. object doesn’t get deallocated), your block won’t get called so any assertions you put in there will just silently not happen. So, have your block set a variable and at the end of the test, do an STAssertTrue() on the variable.

• • •

Keep in mind that there are a couple of important caveats:

  1. You cannot retain the object you are “observing” in the block itself as this will create a retain loop and the observed object (as well as the glue) will never be dealloc’ed. Note that just referencing an object retains it unless you assign the object to a variable declared with __block. This has already been done for you in my code as the cleanup block is sent a non-retaining reference to the object being freed so use that reference instead.
  2. 
    	[self addCleanupBlock:
    		^(id object)
    		{
    			// Do not reference "self"
    			[object doSomething];
    		}];
    
  3. It’s not defined when in the deallocation process the associated object is freed. As a result, you can’t rely on any state of the observed object as it may be the case that all its ivars have already been released. But, you can have the block “capture” variables and the block will retain and subsequently release them. For instance, if you want to log the “name” of an object as it’s deallocated, you can reference the name in the block and it will be retained. But be careful though, if you reference an ivar in the object directly, you end up retaining that object. So, if the observed object is creating the block and you access its ivar in that block, you end up implicitly retaining the observed object, which is in violation of point 1 above. In those cases, assign the ivar to a local variable and use that (in this case, do not use __block in the variable declaration as you want the block to retain the object.
  4. 
    	NSString	*localName = _name;	// _name is an ivar
    	[self addCleanupBlock:
    		^(id object)
    		{
    			// Do not reference _name here as that will implicitly retain self
    			NSLog(@"Object %@ has been deallocated.", localName);
    		}];
    

I suggest reading up on the memory management issues with blocks as described here. Joachim Bengtsson has a great article on blocks (that link goes to the section relevant to this article but I recommend reading the whole thing) and there is always Mike Ash’s reliable series of articles on the subject, which I have consulted many a time myself.

Comment » | Cocoa, Debugging, Downloads, OS X, Programming

New Tool On The Block: The LLVM/Clang Static Analyzer

July 7th, 2008 — 10:30pm

Over the weekend, Gus Mueller turned me on to the LLVM/Clang static analyzer. And just in time, too, as I was polishing up my 2.2 release (which went up earlier today).

It’s an offshoot of the LLVM and Clang projects (read the respective pages on what they are if you don’t know already). The static analyzer analyzes your code and looks for problems, focusing mainly on memory allocation patterns, in this case, including Objective-C/Cocoa (retain/release/autorelease) and CF (CFRetain/CFRelease) semantics.

Take this contrived example for instance:

  id foo()
  {
      NSArray       *array = [[NSArray alloc] init];

      if ([array count] > 0)
      {
        return nil;
      }
      return [array autorelease];
  }

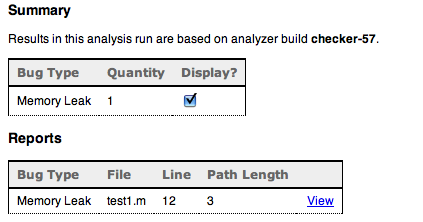
The example above will get you a report like this (it generates html):

checker1.png

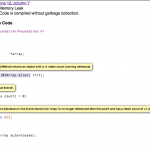
Drilling down you get this (still in html):


checker2.png
(click to enlarge)

Here you can see it pointing out [1] where the object was allocated [2] the branch it took and [3] the point where you leaked it. Pretty neat. It tries to follow every possible branch finding paths where you may have leaked an object. It also finds what it calls “dead stores” (when you assign a value to a variable but never use it again) and missing dealloc methods

As the project page says, it is very early in development. You’ll find that it does turn up a lot of false positives, especially with the missing deallocs. False positives for memory leaks seem to occur when you release something in a different scope than where you created it. For instance, I have this chunk of Apple code that wraps CFRelease() with it’s own function that checks for NULL first. The checker complained about this every time. Nonetheless, it did turn up some real leaks for me.

Aside from reducing the number of false positives, I’d also like to see the entries grouped by source file (it’s annoying jumping around between files) as well as some way to bring up the original source file by clicking on its name in the source code view. You will also see multiple entries for the same leak when the code traverses multiple paths that end up with the same leak which can be annoying.

In any case, I recommend downloading it and giving it a try. I’m not sure how thorough it is (i.e. whether it can supplant running your program through MallocDebug/Instruments/leaks) but it makes a great additional tool to add to your arsenal. Chances are it will look at some code path that you don’t test. Oh, and a couple tips:

  • Make sure you do a clean build on your project first. The checker only runs on files that would normally be compiled (it sits in as your compiler). If your project is already built, then no files will be compiled/analyzed.
  • Use the -V option, which will pop open a browser with the analysis page when done. Normally, it sticks the files somewhere under /tmp but only shows the actual path when you start the run. Needless to say, that bit of text scrolls off pretty quickly.
  • While the tool does come up with false positives, you’ll find that sometimes it finds something subtle that you may blow off as a false positive on first glance. Make sure you understand what it is flagging, even if it ends up being wrong.

I haven’t used it with a garbage collected program so I don’t know if it uses different techniques in such a case or is just plain unnecessary. Maybe the dead store detection becomes more important. Reports from anyone using this with GC are welcome.

3 comments » | Debugging, Programming, Software, Tools

Adventures in Debugging: Pref Pane Poppin’ Aplenty

April 23rd, 2008 — 3:34pm

As you may or may not know, Hazel is packaged as a preference pane. While you do all the configuration via the preference pane interface, the actual work of running your rules is done by background processes. The commandline tool that actually runs the rules is stored inside the pref pane bundle. I’ve kept it in the Resources part of the bundle for no good reason except that’s the catch all for all your bundle stuff. But then I thought, “why not stick it in the MacOS dir. That’s where executables are supposed to go, right?”

So, I went into XCode and created a new “Copy Files” phase to copy the built executables into the “executables” dir (which ends up being the MacOS dir in your bundle). I modified the code that launches the program to look in the right place (NSBundle’s -pathForAuxiliaryExecutable: for those of you keeping score at home). It seemed to work. My bundle was now a tad tidier with things in their proper place.

Later on, I was testing something else and noticed that when Hazel was running certain rules, the pref pane icon would show up in the dock and then disappear when the background program was done. Strange enough that a pref pane icon would appear in the dock; stranger that it was being triggered by a non-GUI program. More testing revealed that it happened when Hazel was executing AppleScripts. I tried isolating the AppleScript parts. I checked all sorts of paths. I couldn’t figure out what was causing it. The Pope was in town so maybe he was messing things up somehow.

I checked previous versions to isolate when the bug was introduced and discovered it was only in the last set of changes. Moving the executables back to Resources fixed it.

Problem solved but I had no idea why. After muttering about it in IRC, Mike Ash casually throws out the explanation: “the binary is hitting the window server, the window server notices that it’s in an executable directory of a bundle, sticks it in the Dock.”

Of course, it all sounds so simple when you hear the answer. Calling the AppleScript created the window server connection which then prompted it to throw the icon in the dock as if it were a regular app. Not sure how long it would have taken me to figure that out on my own.

The lesson here is that when faced with a crazy bug, ask Mike Ash. Really, though, don’t do that. He’ll crash his glider into me next chance he gets. The real lesson is that you should be careful about putting executables for background programs in the MacOS directory of your bundle.

Ok, so I can’t pin this one on the Pope. All I know is that I don’t get these types of problems when the Dalai Lama is in town.

2 comments » | Cocoa, Debugging, Hazel, Programming, Xcode

Happy Fun Leopard Bug Time: NSCalendar

January 25th, 2008 — 10:38am

Yes, folks, it’s Happy Fun Bug Time where I talk about what has been making me tear my hair out recently. In this installment, we talk about NSCalendar.

NSCalendar has a method called rangeOfUnit:inUnit:forDate:. What this method is supposed to do calculate how many of one time unit are in another. For instance, how many days are in a particular month. Since date calculations can get tricky, with daylight savings, leap years and all, this method is quite handy.

Or, it would be handy if it didn’t suffer from some pretty bad bugs on Leopard. At first, I tried something like the following to calculate the number of days in a given year:

  range = [[NSCalendar currentCalendar] rangeOfUnit:NSDayCalendarUnit
                                             inUnit:NSYearCalendarUnit
                                            forDate:[NSDate date]];
                                  
  NSLog(@"%@", NSStringFromRange(range));

Given that this is a leap year, I’d expect “{1, 366}”. What do I get? “{1, 31}”. I suspect that wires got crossed with the days-in-a-month calculation. Oh, but the fun doesn’t stop there. Try this at home (kids: do not try this at home):

  NSCalendarDate          *date;
  int                     i;
  
  date = [NSCalendarDate dateWithYear:2007 month:1 day:1 hour:0
                               minute:0 second:0 timeZone:nil];
  
  for (i = 0; i < 365; i++)
  {
    range = [[NSCalendar currentCalendar] rangeOfUnit:NSDayCalendarUnit
                                               inUnit:NSWeekCalendarUnit
                                              forDate:date];
    
    if (range.length != 7)
    {
      NSLog(@"Date %@ has week of length %d", date, range.length);
    }
    date = [date dateByAddingYears:0 months:0 days:1 hours:0 minutes:0 seconds:0];
  }

This cycles through each day of last year (2007) and calculates the number of days that week. Now, having just recently lived through that year, I think I can say with some certainty that no week had any more or less than 7 days in it. The above code prints out any oddballs. If you run it yourself, you find that quite a few days are in weeks exceeding 7 days. Upon closer inspection, you find that any day in a week straddling two months reports the number of days in the month, not the week. On weeks fully contained within a month, it reports 7 days. Again we are seeing a tendency towards the days-in-a-month calculation. Someone really likes computing that.

I've filed a bug report (rdar://5704940 for you Apple folks). Unless I'm doing something really wrong here or there were some time distortions last year that I was unaware of, you may want to avoid using NSCalendar's rangeOfUnit:inUnit:forDate: on Leopard for the time being. Thinking about it though, the time distortions would explain a couple weekends…

Update (Feb. 1, 2008):
I strongly recommend reading the comments. Thanks to Chris Suter for explaining what Apple's logic is in doing it this way. We all thought he was nuts at first but it appears that he was just explaining Apple's craziness.

In short, things probably are working as designed by Apple. I still think the design is flawed and that it is horrendous API. It seems that, in Apple's mind, Leopard is correcting a bug in Tiger (in other words, the intuitive and useful behavior in Tiger was a bug).

The original point stands that one needs to take care with -rangeOfUnit:inUnit:forDate:. It seems to be only useful for specific combinations of units and given the change in behavior between Tiger and Leopard, it becomes even more of a headache. If Apple is going to continue with this interpretation, then they should just treat these computations as undefined since the results are misleading.
17 comments » | Cocoa, Debugging, OS X, Programming

You’re Doing It Wrong

October 25th, 2007 — 11:00am

In IRC, someone noted how they just learned about gdb’s print-object (or po) command. It was surprising since this was an experienced dev. It just goes to show that no matter how long you’ve been programming, there’s always some thing you should know, but don’t. These are those commands or features you just somehow missed. You bitch about what a pain in the ass something is only to realize that there was a simple solution all along.

So, in the interest of full disclosure, here are a couple of mine.

NSStringFromRect(), NSStringFromRange(), NSStringFromPoint(), et al.

Stupidly, whenever I needed to log an NSRect, NSRange, etc., I’d list out each of the components. For NSRect, it was always the worst, as it would look like this:

NSLog(@"%f %f %f %f", NSMinX(rect), NSMinY(rect), NSWidth(rect), NSHeight(rect));

I could have put this in a #define but for some twisted reason I would just keep copying it from other places or worse, typing it out. I finally learned about the above functions and now my teeth are whiter than ever!

Dragging header files into IB

For years, when I needed to have the header file for my class read into IB, I’d click on the “Classes” tab, select my class, do “Read Files…” (because of peculiarities in my project, the “Read Something.h” item is not enabled) and select my file in the open panel. The step of clicking on the “Classes” tab seemed particularly ridiculous to me if you had an instance of the class selected in the “Instances” pane.

At the last Cocoaheads meeting, Cathy Shive was giving a presentation on doing custom controls. While demonstrating how she put together the nib, I watched in amazement as she dragged the header file into the IB window to update her outlets and actions. I suppressed a sob as I reflected on all the time I wasted.

Command-double-click and option-double-click in XCode

In XCode’s editor, command-double-clicking on a symbol will bring up its definition, opening the appropriate header file as needed. Option-double-click brings up its documentation. You know. Me no know. Me ashamed.

• • •

Maybe these are news to you as well and if so, then I feel slightly less dumb. There are probably worse cases than this but I have erased all traces of them from my memory.

What are your embarrassing discoveries?

10 comments » | Cocoa, Debugging, OS X, Programming

A Different Kind of Bug Database

March 22nd, 2007 — 11:03am

When it comes to debugging, programmers become a bit like doctors. You look at the symptoms. You run some tests. You poke. You prod. You get your code to turn and cough. With any luck, you come up with the correct diagnosis and address the problem.

Of course, we aren’t always right or we forget how we fixed that one bug last year. As a result, we spend much more time on a bug than is necessary as we have to “re-learn” it.

Now, I’ve heard that doctors have access to databases where they can look up cases and cross-reference symptoms and diseases. Why not something similar for programmers? It’s a bug database, but not the type of database you normally use. It would be a meta-bug database of sorts. It would list bug “symptoms” from which you can find explanations of the problem, lines of investigation and possible solutions. It’s like a bug database after you’ve done a post-mortem on a problem.

Here’s a simple example:

Symptoms:
“selector not recognized”

Explanation:
An object is being sent a message that it does not implement.

Further Steps/Solutions:

  • You may have misassigned it. Make sure the object being called is of the class you think it is.
  • You may have freed the object and its memory location subsequently has been populated with something else. Check your memory management.
  • You may be accessing an uninitialized variable. Compile with -Wuninitialized.

Now, the last one I listed there was not something I would think of immediately, which is the point of this. In addition, I’m sure there are also other cases I didn’t list.

The database would draw upon the collective experience of programmers and would help to guide and expose new avenues of investigation. So, the idea is to start a colloborative, wiki-like bug reference database. I don’t know the how, who and where but I thought I’d put the idea out there to see if it gets any traction. Maybe it already exists in which case let us know about it.

9 comments » | Debugging, Programming

Mystery Bug: Heisenberg’s Uncertainty Principle

March 7th, 2007 — 6:59pm

I’ve spent the past couple hours going crazy over a bug. It’s the type of bug where it breaks except for when you look at it, in which case, it works all the time. Don’t believe me? Compile the following program:

#import <Foundation/Foundation.h>

int main(int argc, const char *argv[])
{
    NSAutoreleasePool     *pool;
    NSString              *path;
    NSDictionary          *dict;
  
    pool = [[NSAutoreleasePool alloc] init];
    path = [NSString stringWithUTF8String:argv[1]];
  
    dict = [[NSFileManager defaultManager] fileAttributesAtPath:path
                                         traverseLink:NO];

    // The busy flag will be NULL if you comment out the next line.
    //NSLog(@"DICT: %@", dict);

    NSLog(@"Creation: %@", [dict objectForKey:NSFileCreationDate]);
    NSLog(@"Busy: %@", [dict objectForKey:NSFileBusy]);
}


By the way, I know I’m not releasing the pool.

Now, take a file and set its busy flag. You can do this as follows:

/Developer/Tools/SetFile -a Z some file

Then run my little program with some file as an argument. Notice how the busy flag is null?

Well, let’s see what’s in the dictionary passed back to us to find out what’s going wrong here. Edit the program above to uncomment the NSLog statement. Run it again. Notice how the busy flag is now set?

It appears that the dictionary is half-initialized until you happen to call certain methods (-allKeys works as well as -description). I haven’t tested every key but it does seem to be peculiar to NSFileBusy.

For the time being, I’m going to switch to Carbon to do this but I’d love to hear theories (or even facts) on what’s going on here. Let the wild speculation begin.

Oh, and since I brought up Heisenberg, I can’t let an opportunity to include an artful rendering of a dead cat pass by so here:

dead cat

6 comments » | Carbon, Cocoa, Debugging, OS X, Programming

Debugging Lesson: Take a Look Back To Go Forward

February 7th, 2007 — 10:30pm

Over the years you learn a few lessons and make a few rules. You swear to yourself that you’ll always follow them but over time you get lazy or you just forget. Especially when debugging, you get in that panicky state where all that goes out the window. Urgency beats out common sense.

Usually when you find a crasher, you end up going at it head-on, in a brute force manner. Run it through the debugger. Carpet bomb the code with log output. Bang your head against the desk. Rinse. Repeat.

The lesson here is obvious (maybe painfully so) but I don’t see it applied enough in practice. I find that it’s commonly forgotten in the heat of the moment and is only heeded as a last resort. Basically, it is this:

If it worked before and is now broken, go back and look at what has changed.

Simple enough. Machines are deterministic and most systems you code are as well. Code usually doesn’t degrade and break on its own; something must have changed to cause the problem. Go back and see if you can isolate the build where the thing broke. If you have QA people, you can parallelize and have them isolate the build while you debug. Now look at the commit logs, starting at that build and go back. Many times, this will be the “a-ha” moment you needed. Even if the changed code is not the actual cause, it’s usually a trigger or it somehow exposes the problem. Now debug, focusing on the areas of those changes.

Now, this doesn’t always work. Maybe the code just acts differently after a certain date for some odd reason (Y2K anyone?) or there’s a hardware glitch or your program is getting input it never received before. But these cases are the exception. I have repeatedly regretted not checking the change logs but not once regretted doing it.

So, now that you know the rule, how do you make sure you follow it next time you’re looking down the barrel of a EXC_BAD_ACCESS error? Try this: set a timer for, say, 10 minutes and then start debugging. When the timer goes off, if you do not have a good sense of what’s going wrong, then stop and check the commit logs. How do you remember to set the timer? Actually, I don’t have good answer for that. Maybe you can write a hook into CrashReporter to start it for you. Or maybe you hire a magical pixie that appears whenever your program crashes and reminds you. Or you combine the two and have CrashReporter somehow wake up the magical pixie who will then remind you to set the timer. Then, just work in a bowling ball and a cuckoo clock and you’re golden.

2 comments » | Debugging, Programming

Back to top