Archive for July 2008


Passenger On Board

July 22nd, 2008 — 7:47pm

I just switched PotionStore to use Phusion Passenger. Also known as mod_rails, Passenger is an Apache module that allows you to run Rails with Apache. Unlike other Apache plugins like mod_php, your application is still run in separate processes. Previously, I had been using Apache as a proxy to a mongrel cluster. On the surface, this doesn’t sound much different but Passenger does give you a couple things:

  • It maintains the pool of Ruby processes for you. It can adjust the pool dynamically as needed in case you want to reclaim memory when it is not busy, for example. You don’t have to worry about setting up and maintaining a separate set of servers like you do with mongrel. It gets restarted with Apache and you can also trigger it to restart just the Ruby stuff. One less thing to administer and monitor.
  • Lower memory footprint if you use Enterprise Ruby (also made by Phusion). It will share resources between the Ruby processes.

Luckily, Andy Kim already played guinea pig and tried it out to make sure it worked. Many thanks to him for that (and for the whole PotionStore thing to begin with, of course).

While the setup was fairly simple, I ran into a couple odd issues. For one, the Enterprise Ruby installer seemed to screw up the permissions of some of its files. All of its .so files and a directory or Ruby file here and there were set to be only readable by the owner. Make sure to check this before deploying. Note also that it installs as a totally separate Ruby installation so run its version of gem to make sure your Ruby packages match what you had on “regular” Ruby. For those of you are running PotionStore, make sure to do a rake rails:update otherwise it’ll bomb and log a message telling you to do so.

Unfortunately, I didn’t record the memory usage beforehand so I don’t know the exact gain. Based on my recollection, it does seem like I have maybe 20M or so more than I did before (for two Ruby processes). One odd thing I’ve noticed in my graphs is that my interrupts and context switches plummeted immediately. Not sure why that is but it seems like a good thing to me.

While this doesn’t remove Rails’ lack of thread-safety problem (resulting in a separate process per request), it does at least make the deployment much, much easier and with the memory savings, a bit more scalable as you take less of a memory hit with each extra Ruby process. Especially for those of you that have not deployed yet, this will save you a bit of a headache in configuration (no proxy and mongrel setup). It’s only been up for a couple days so it may be too early to tell but so far it’s been running fine.

Comment » | Ruby on Rails, Software, System Administration, Web
New Tool On The Block: The LLVM/Clang Static Analyzer

July 7th, 2008 — 10:30pm

Over the weekend, Gus Mueller turned me on to the LLVM/Clang static analyzer. And just in time, too, as I was polishing up my 2.2 release (which went up earlier today).

It’s an offshoot of the LLVM and Clang projects (read the respective pages on what they are if you don’t know already). The static analyzer analyzes your code and looks for problems, focusing mainly on memory allocation patterns, in this case, including Objective-C/Cocoa (retain/release/autorelease) and CF (CFRetain/CFRelease) semantics.

Take this contrived example for instance:

  id foo()
  {
      NSArray       *array = [[NSArray alloc] init];

      if ([array count] > 0)
      {
        return nil;
      }
      return [array autorelease];
  }

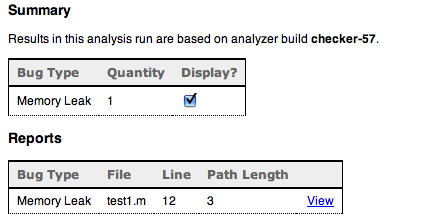
The example above will get you a report like this (it generates html):

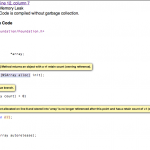
checker1.png

Drilling down you get this (still in html):


checker2.png
(click to enlarge)

Here you can see it pointing out [1] where the object was allocated [2] the branch it took and [3] the point where you leaked it. Pretty neat. It tries to follow every possible branch finding paths where you may have leaked an object. It also finds what it calls “dead stores” (when you assign a value to a variable but never use it again) and missing dealloc methods

As the project page says, it is very early in development. You’ll find that it does turn up a lot of false positives, especially with the missing deallocs. False positives for memory leaks seem to occur when you release something in a different scope than where you created it. For instance, I have this chunk of Apple code that wraps CFRelease() with it’s own function that checks for NULL first. The checker complained about this every time. Nonetheless, it did turn up some real leaks for me.

Aside from reducing the number of false positives, I’d also like to see the entries grouped by source file (it’s annoying jumping around between files) as well as some way to bring up the original source file by clicking on its name in the source code view. You will also see multiple entries for the same leak when the code traverses multiple paths that end up with the same leak which can be annoying.

In any case, I recommend downloading it and giving it a try. I’m not sure how thorough it is (i.e. whether it can supplant running your program through MallocDebug/Instruments/leaks) but it makes a great additional tool to add to your arsenal. Chances are it will look at some code path that you don’t test. Oh, and a couple tips:

  • Make sure you do a clean build on your project first. The checker only runs on files that would normally be compiled (it sits in as your compiler). If your project is already built, then no files will be compiled/analyzed.
  • Use the -V option, which will pop open a browser with the analysis page when done. Normally, it sticks the files somewhere under /tmp but only shows the actual path when you start the run. Needless to say, that bit of text scrolls off pretty quickly.
  • While the tool does come up with false positives, you’ll find that sometimes it finds something subtle that you may blow off as a false positive on first glance. Make sure you understand what it is flagging, even if it ends up being wrong.

I haven’t used it with a garbage collected program so I don’t know if it uses different techniques in such a case or is just plain unnecessary. Maybe the dead store detection becomes more important. Reports from anyone using this with GC are welcome.

3 comments » | Debugging, Programming, Software, Tools

Hazel 2.2

July 7th, 2008 — 3:04pm

Yes, it’s finally out. Hazel 2.2 is what I consider the “power user” release. It adds advanced features such as pattern matching and custom tokens (basically, a more accessible form of regular expression matching and substitution, for you programmer types out there), inline scripts and ways for AppleScripts to control the rule flow. There are a bunch of smaller things tucked away in there, some of them subtle in their own ways. Make sure to read the release notes.

Thanks to all the beta testers who found all the bugs there were to find (you guys did find them all, right?) and all the users who have sent in the great comments that motivate me to keep working on this thing. Download it and give it a spin.

As for the future, I’m thinking of 3.0 though I’m not sure what will be in it yet or when it will happen. I also have been mulling over other projects so we’ll see. In the meantime, I look forward to your comments.

Comment » | Hazel, Noodlesoft, Software

Back to top