hazelworker processes runaway memory consumption

Get help. Get answers. Let others lend you a hand.

Moderator: Mr_Noodle

Apologies if this has been covered elsewhere already, but I couldn’t find anything relevant, so I will post my issue here: since updating my MBP to Mojave, Hazel background helper processes (hazelworker) have been using inordinate amounts of memory, bringing my MBP to a standstill. I’m posting two screenshots to illustrate this: the first after the machine has been running a few days unattended (mostly sleeping, for whatever value of sleep modern MacOS machines still get), the second about one and a half hour after rebooting the machine on discovery of the first:

Image

Image

As you can see, Activity Monitor lists the three active hazelworker processes as consuming over a 100 GB(!) of memory, with my MBP exhibiting all symptoms of a machine out of memory (apps starting in ultra slow motion, if at all, UI generally molasses like sluggish; all issues stopping as soon as I stop Hazel and its helper processes disappear).

I’d be happy to send any information useful to resolve this, but I don’t want to spam the forum with unrelated info and log files, so I will keep the summary short: currently running Hazel 4.3.1 (1524) on macOS 10.14.0, German locale (MacBook Pro Retina 15', mid 2015).
kopischke
 
Posts: 9
Joined: Fri Nov 06, 2009 6:41 pm

Can you do the following?

- Launch Activity Monitor. Find the process in question. Note its PID.
- Do "Sample Process" and send me the output.
- In Hazel's "Info" section, click on "View Log"
- In the search field, enter "[XXXX]" where XXXX is the PID noted earlier. Send me that output.

Since it's log output, you might be more comfortable emailing it than posting but it's up to you.
Mr_Noodle
Site Admin
 
Posts: 11240
Joined: Sun Sep 03, 2006 1:30 am
Location: New York City

I’ve uploaded an archive of all requested data (process samples and log extracts for three different PIDs, as well as a screenshot illustrating the memory consumption of these three) here: https://cl.ly/d1e3a2cbf2bc. Thanks for looking into this!
kopischke
 
Posts: 9
Joined: Fri Nov 06, 2009 6:41 pm

Thanks for that. It seems it's busy with JavaScript in your rule. Also, it looks like you have a bunch of files in there. I'm guessing in combination, that is resulting in a lot of resource usage.

Can you post your rules and script?
Mr_Noodle
Site Admin
 
Posts: 11240
Joined: Sun Sep 03, 2006 1:30 am
Location: New York City

I can do that; there are, however … um, rather a lot … of them with a large subset using JavaScript matches / actions. The good news is all of these are inline scripts, with some external dependencies, so I suppose uploading folder rule exports (+ the script libraries the JavaScript rules depend on) would work for you? Or is there another format you would prefer?

Edit: I went ahead and uploaded both the Hazel rules I use and the script libraries their JavaScript matches / actions depends on (these need to go in ~/Library/Script Libraries to be picked up) here: https://cl.ly/e16f04d78da1
kopischke
 
Posts: 9
Joined: Fri Nov 06, 2009 6:41 pm

… note that, as I stated in the original report, the issue started with macOS 10.14; I am aware that I am using a rather large set of rules with a liberal dose of scripting on some big directory hierarchies, but the rules worked without causing runaway memory consumption on macOS 10.12. However, now that I think of it, Hazel would sometimes stop processing rules and would need a restart on High Sierra (some kind of throttle by the OS Mojave did away with? I have no idea, just wanted to mention this as it might be related).
kopischke
 
Posts: 9
Joined: Fri Nov 06, 2009 6:41 pm

There are a bit too many files for me to wade through here. If you can point me to specific ones that are relevant, I can take a look at those.

But you are scanning a ton of files. I don't know how necessary that is but you may want to look into having a staging area where files come in that you process and move to the final folder structure elsewhere.
Mr_Noodle
Site Admin
 
Posts: 11240
Joined: Sun Sep 03, 2006 1:30 am
Location: New York City

Mr_Noodle wrote:There are a bit too many files for me to wade through here. If you can point me to specific ones that are relevant, I can take a look at those.


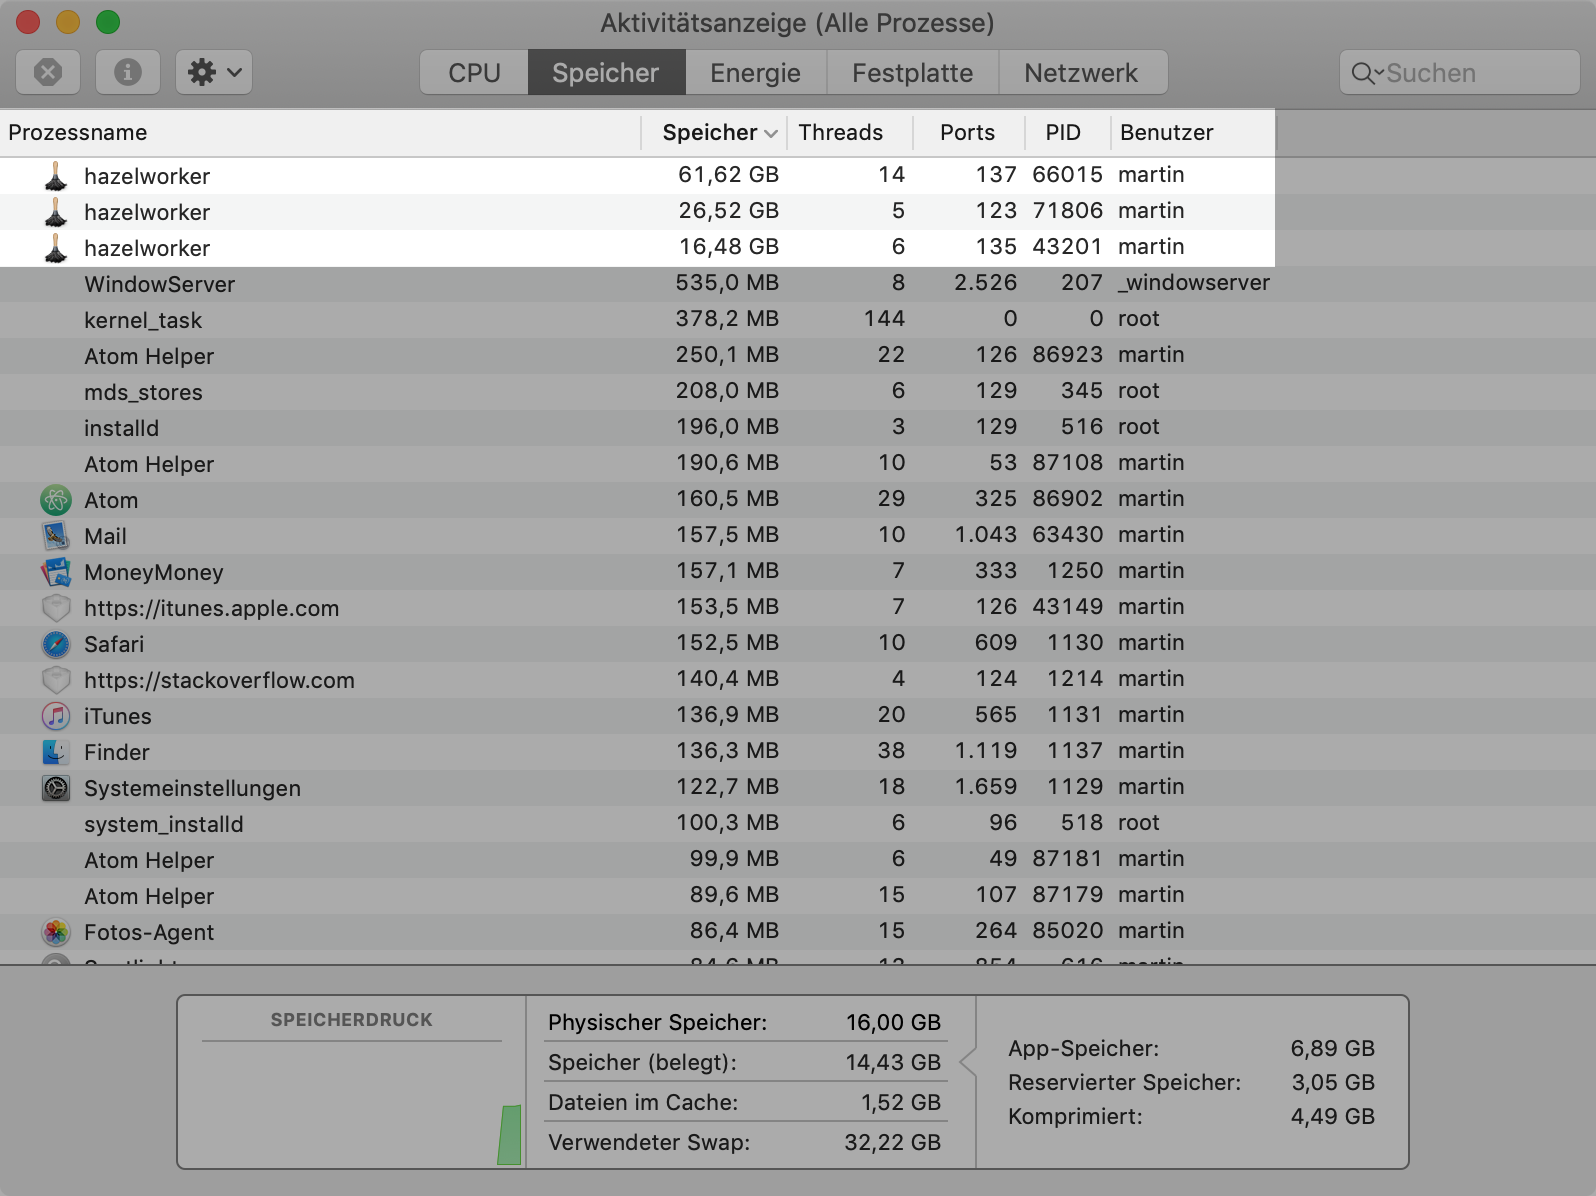
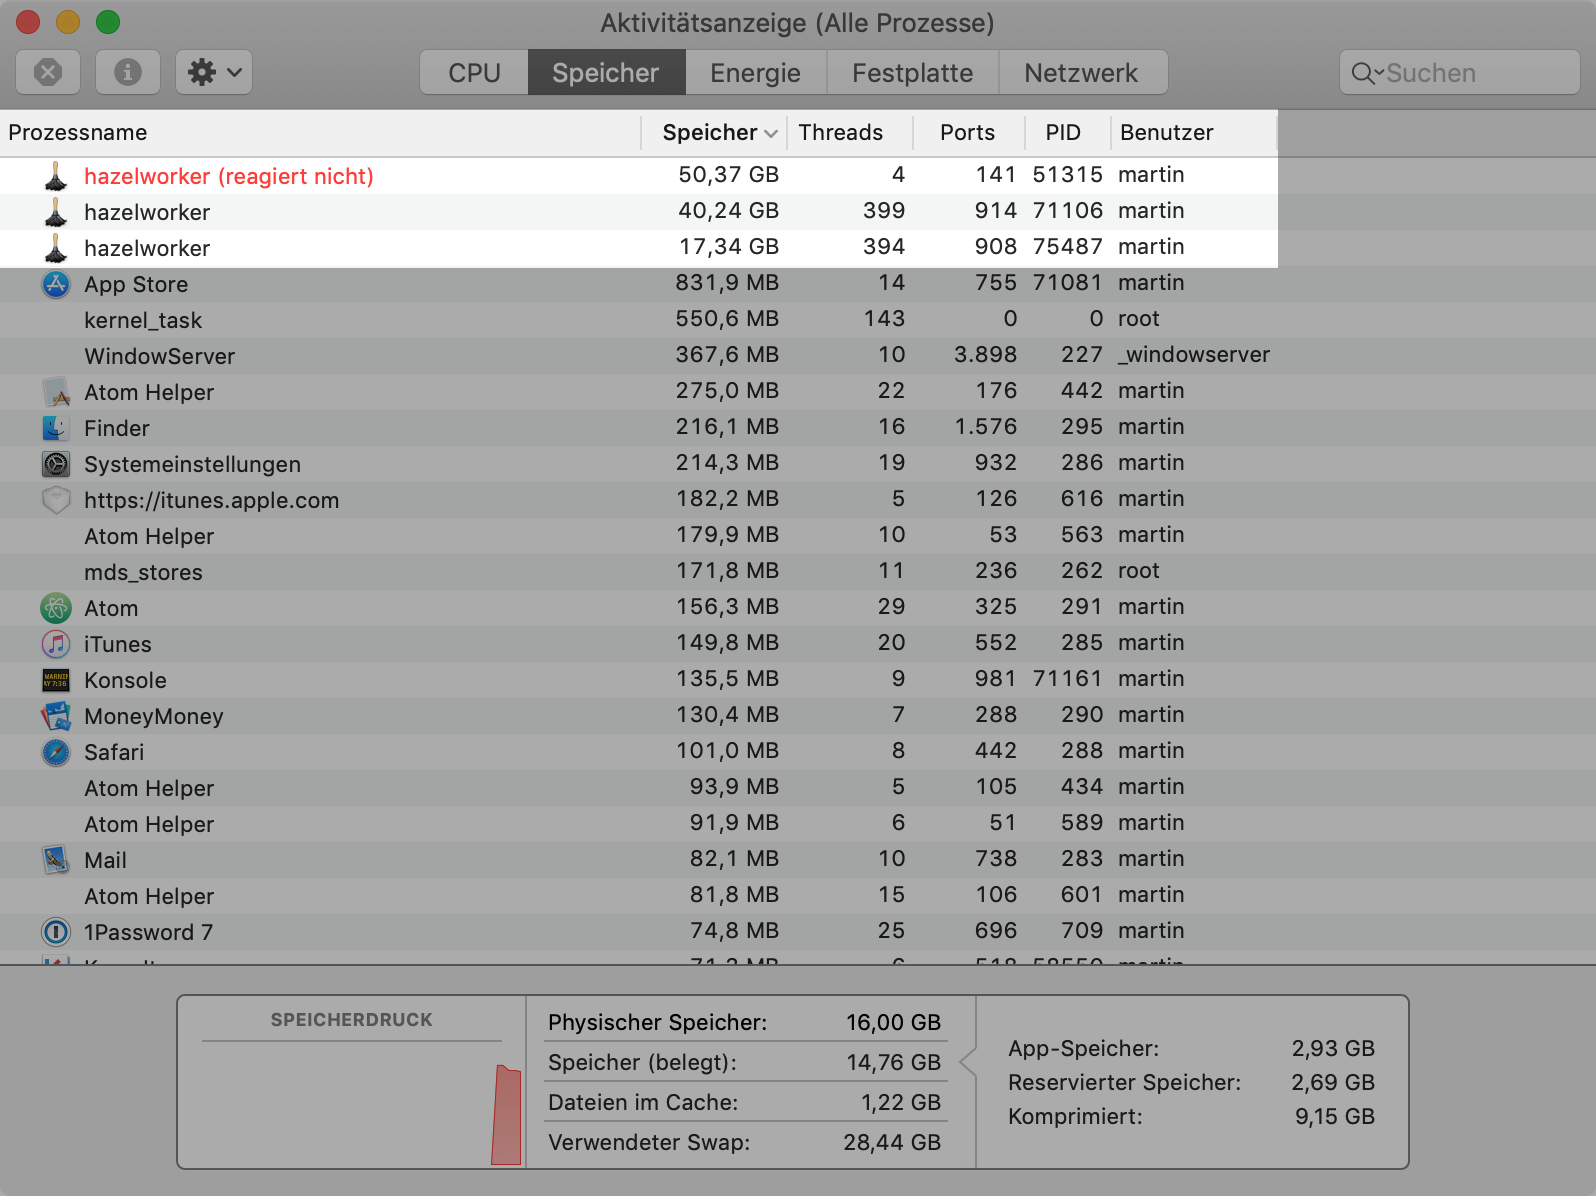
I can understand that, and I am absolutely willing to help narrowing that set down, but my problem is I have no idea which are relevant. As I said, my rule set and watched directories did not change with the update to Mojave, at all; only their memory consumption did, rather abruptly. Did the process analysis and logs I sent happen to yield any pointers to directory hierarchies or rule names I should be looking for? Or maybe you could give me an idea how to read these for clues? I’d be very grateful for any pointers, as I had to disable Hazel entirely for the time being.

Mr_Noodle wrote:But you are scanning a ton of files. I don't know how necessary that is but you may want to look into having a staging area where files come in that you process and move to the final folder structure elsewhere.


I do have such a staging area (my Downloads folder) in my Hazel config, and it does a lot of heavy lifting, but I also use Hazel for a ton of tasks beyond simply shoving files around. For instance tagging (and untagging) files according to the directory hierarchy I file them in, alerting me to files that are stale, adding metadata to some media types, collating metadata from file categories, extracting and processing files from app containers and more … most of these bypass staging entirely (because they are dependent on the file’s ultimate location, or on the time passed while filed, or on apps or cloud services I have no control over, or because the filing happen on mobile devices with no access to my local Downloads folder). So, yes, for my, admittedly very personal, usage case this is necessary, and it was puttering along (mostly) fine while I still was on 10.12.
kopischke
 
Posts: 9
Joined: Fri Nov 06, 2009 6:41 pm

The sheer number of subfolders it does into is enough to cause some concern though I don't see a mention in the logs of which JavaScript is being executed.

Try re-enabling debug mode as described here: https://www.noodlesoft.com/kb/hazel-debug-mode/

After that, send me new samples and logs.
Mr_Noodle
Site Admin
 
Posts: 11240
Joined: Sun Sep 03, 2006 1:30 am
Location: New York City


Return to Support